Single family real esate market trends by county and price range.
Data and graphs from Trendvision can be found in the linked PDFs. The comments on this page are not financial advice, and intended only as a quick summary to help you keep an eye on the markets. Please refer to the underlying data, provided by Bareis MLS, for more information.
North Bay: Marin, Napa, and Sonoma Counties
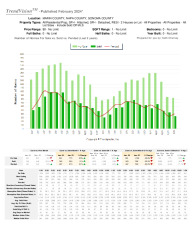
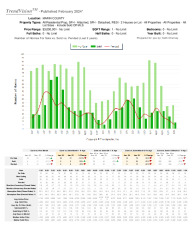
January is typically the slowest month for the year for both listings and sales. Compared to last January, for sale, sold, and pended (entered into contract) listings are all up by 8.5-11%. However last January was extremely slow, and those same metrics are still 23.2-36.8% below January of 2022. The time to sell, measured in day on market, is 12.9% slower than last year, and 34.6% below January 2022. Homes are selling at 93% of original listing price, so the market is generally a little slower than sellers are anticipating when they list their properties. There are about 2.5 months of inventory available right now. Although this is not the best indicator of the market in January, since things typically pick up considerably from February to April. A large part of the market trends can be explained by continued high interest rates, although their projected relative stability over the medium term has led to more people actively engaging in the market.
All Marin properties
Marin county has a strong sales month, with 29.7% more sales than January last year. That places it roughly at the midpoint between last year and 2022. For sale and pended properties are down a bit compared to last year, indicating a potential upwards pressure the market over the next month or two. In fact, even though days on market is up, sales to listing price ratio is 95%, already up 5.6% compared to last year.
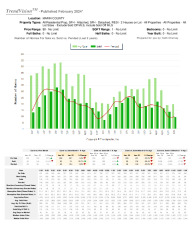
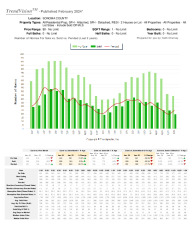
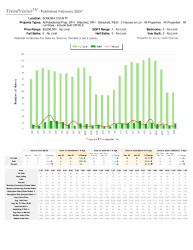
Marin properties to 1 million
The base price properties for Marin county were distinctly contrary to the overall trend. Fewer homes were sold, and greater drops in the for sale and pending groups. Average days on market were up quite a bit at 35.7% over last year, although sale to listing price ratio remained firm, at 94%. This could all be explained in part by a general trend of higher prices, leaving fewer homes in the sub 1 million market, as well as higher interest rates adversely affecting buyers in this market segment more than in more expensive segments.
Marin properties from 1-3 million
There was a surge in January sales in the Marin mid-level market compared to a year ago. There was an impressive 57.9% increase in sales, with more modest but still significant increases of 14.1% and 5.6% in for sale and pending listings, respectively. This contrast to the decline in sold homes in the below 1 million market would seem to confirm that more homes are selling for a bit over 1 million compared to a bit below it.
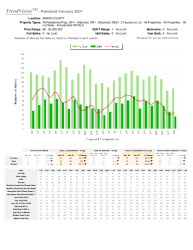
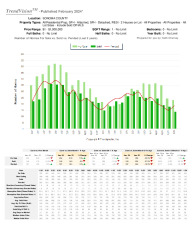
Marin properties over 3 million
Homes in the 3 million plus market are much less apples to apples comparison to each other than those in the lower and mid-level segments. Specific details of the home and the land dictate price to a greater degree. The number of home in this market segment also lends itself poorly to statistical analysis. That said, it is of note that there were fewer homes to market, and significantly higher days on market in this market segment compared to last year (and of course a fortieri to 2022).
All Sonoma County properties
The Sonoma County market was generally more active in January, Sale up 5.3%, for sale up 13.3%, and pending up even further, at 20.7% compared to last year. These numbers, while still well below January 2022 levels, indicate stronger demand for real estate. The number of properties for sale was almost 200 higher than those pending, so even with this strong demand, I don’t think prices will take a huge jump in the near future, even though months of inventory remains low. This is correlated with longer days on market and lower sale to listing price ratios compared to last year. At 93% sale to listing price ratio compared to 98% in January 2022, Sonoma County is perfectly mirroring the overall north bay market trend.
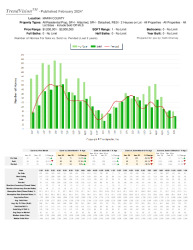
Sonoma County properties below 1 million
Homes below 1 million make up over 50% of the Sonoma County market. Like Marin, the number of sold and pended listings in this segment was a bit below the market average, likely due to that interest rate pressure on buyers in this segment. Sold listing were actually down by 6%, which pending listings were up 14%, which is a little over 6% less than the Sonoma County market average noted above. Days on market were down, and sale to listing price ratio was up. This indicates a strong competition among the buyers able to buy in this segment. Anecdotally, what I have seen with my buyers is that there is very high interest for the more desirable properties, and an above average aversion to properties that require more work or are maybe not in quite as desirable of a location as compared to past years. People want to buy, but they also want to get their money’s worth. That makes perfect sense to me given the high interest rates.
Sonoma County properties from 1-3 million
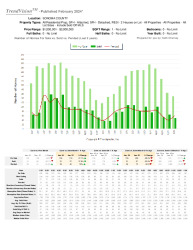
The Sonoma County mid-level market is strong on all basic metrics. Sold listings were up a huge 37.8%, for sale up 27.1%, and pending up an almost astounding 50% compared to last year. Of course, all thee number remain well below 2022, by about 20-28%. Despite this market activity, days on market is up and sale to listing price ratio is low, at only 89%. These numbers seem to indicate a couple things to me: There is a strong demand for properties in this price range in Sonoma County, but people are looking for affordable luxury, while sellers have not yet received the memo and are pricing their properties quite a bit higher than the market can bear compared to almost all other segments throughout the north bay. This market segment has been a bit slow to correct in my humble opinion, but I would expect pricing to converge a bit more closely with the market in the coming months.
Sonoma County properties over 3 million
As indicated in the Marin County high end segment above, statistics break down a bit on the highest end properties due to their unique features. Although the ratio of for sale to sold properties remains relatively high meaning there is decent supply, it is lower than last year, and the days on market are down. There are some absolute gems in this price range in Sonoma County, both in the wine country and on the coast.